

How Air Force Special Warfare Recruits Stack Up: A Look at Real Fitness Data (2019–2023)
About 35,000 candidates join the US Air Force each year. Some of these ambitious ones get to take the arduous path of becoming the US Department of Air Force’s Special Warfare (SW) candidates.
In fiscal years 2019-2023, a total of 171,913 recruits entered the US Air Force’s Basic Military Training. And only 3,900 of those chose to become the Special Warfare (AFSPECWAR) candidates. A team of researchers (John D. Mata et. al.) decided to study these candidates in their journey to figure out the differences between Special Warfare candidates and non-SW candidates in terms of anthropomorphic and physical fitness characteristics.
By studying the results of the study, we can identify how to best train and set expectations for aspiring Air Force Special Warfare candidates.
1. What is Air Force Special Warfare (AFSPECWAR)?
Before we proceed to the research methodology, let me clarify the distinction between Special Warfare and non-Special Warfare candidates. When we say “Special Warfare” in the Air Force, we’re talking about a select few career fields that demand elite-level fitness, grit, skill, and mental resilience.
These include Pararescue (PJ), Combat Control (CCT), Tactical Air Control Party (TACP), and Special Reconnaissance (SR).
Once you enlist in the US Air Force, the first step is ~8 weeks of Basic Military Training (BMT) at Joint Base San Antonio-Lackland. BMT is what qualifies you for the title of “Airman.” But here’s the catch: the decision to try out for AFSPECWAR is made before you ever step foot in BMT.
Special Warfare candidates partake in BMT with their SW groups. The BMT process is identical for both SW and non-SW candidates in terms of physical fitness assessments (PFAs) and other tests. AFSPECWAR recruits roll straight from BMT into the pipeline, which can stretch beyond two years depending on the career field.
If you choose the AFSPECWAR path, you’re looking at a 2+ year pipeline that includes:
- Basic Military Training (BMT)
- Special Warfare Prep Course
- Assessment & Selection
- Tech schools, depending on your career field (PJ Indoctrination, Combat Control School, etc.)
- And follow-on advanced training like dive school, airborne, and survival school
2. Methodology & Materials of the Study
As mentioned earlier, researchers dove deep into Department of the Air Force Basic Military Training (BMT) data from fiscal years 2019 to 2023.
First, a few filters. The study only analyzed male candidates aged 17 to 30. Female recruits (N = 43,897) were excluded due to significant physiological differences and the low number entering AFSPECWAR. Additionally, 8,601 recruits over the age of 30 were removed to maintain age-based consistency.
After exclusions, the final sample for anthropometric analysis included 119,415 men, with 3,604 SW (3%) and 115,811 (97%) non-SW candidates. However, due to missing data for the physical fitness assessment (PFA) comparisons, the sample size was further reduced to 103,095 total candidates (3,323 SW and 99,772 non-SW).

2.1. Physical Fitness Assessment (PFA)
All fitness data was captured during Week 1 of BMT, before trainees began any structured physical training program. That means the recorded numbers offer a raw glimpse of their baseline fitness prior to entering these tests. In short, this is what they came prepared with, and you should too.
During BMT, the physical fitness assessment (PFA) is conducted three times, consisting of three subtests: maximum push-ups (MPU) in 60 seconds, maximum sit-ups (MSU) in 60 seconds, and a timed 1.5-mile run (RUN).
| Variable | Minimum | Maximum |
|---|---|---|
| Height (in.) | 58 | 80 |
| Weight (lbs.) | 84 | 260 |
| 1.5-mile run (minutes) | 6 | N/A |
| Sit-ups (MSU; number of repetitions) | 0 | 200 |
| Push-ups (MPU; number of repetitions) | 0 | 200 |
Each recruit’s PFA scores were pulled from the Electronic Basic Training Management System. Meanwhile, demographic details (age, height, weight, BMI, etc.) were sourced from the Air Education and Training Command Technical Training Management System.
To determine who was SW and who wasn’t, the researchers looked at each recruit’s intended Air Force Specialty Code (AFSC) at enlistment. If it matched one of the SW roles (PJ, CCT, SR, or TACP), they were flagged as “SW = Yes.”
2.2 Data Cleanup
Not every data point was included. To ensure accuracy, the study excluded entries with height and weight values that fell outside official BMT standards (58–80 inches for height and 84–260 lbs for weight). In addition to this, any outliers that would’ve caused anomalies were also cleaned out. For example, 5-minute 1.5-mile runs or 300 push-ups. These were likely input errors or exempted edge cases, and the researchers didn’t have documentation to verify them.
Here are the accepted performance ranges:
- 1.5-mile run: 6 minutes minimum (no upper limit provided)
- Sit-ups & Push-ups: 0 to 200 reps
2.3 Statistical Methods
To compare groups, the researchers used a mix of independent t-tests and chi-square tests. For more complex insights, a two-way ANOVA was applied. It examined how both SW status and fiscal year impacted factors such as runtime, reps, height, and BMI.
These methods of statistical analysis ensured the validity of results using Levene’s test for variance and the Shapiro-Wilk test for normality. Post hoc comparisons were done using the Tukey-Kramer method, with α < 0.05 set as the threshold for statistical significance.
3. Results Overview
Out of the 103,000 male candidates who attended the Air Force’s Basic Military Training (BMT) between FY 2019 and 2023, only 3.2%, or roughly 3,323 individuals, had their sights set on Air Force Special Warfare (AFSPECWAR) roles.
Across almost every measurable factor — age, height, weight, BMI, and physical performance — the SW group showed statistically significant differences compared to non-SW candidates. However, not all those differences were meaningful in real-world terms.
| Factor | Total N | Total Mean | Total SD | SW N | SW Mean | SW SD | Non-SW N | Non-SW Mean | Non-SW SD | p-value | Effect size | Magnitude |
|---|---|---|---|---|---|---|---|---|---|---|---|---|
| Age (years) | 103095 | 22.75 | 2.81 | 3323 | 23.35 | 3.04 | 99772 | 22.73 | 2.8 | <0.001 | -0.22 | Small |
| Height (in.) | 102483 | 69.64 | 2.92 | 3313 | 70.03 | 2.67 | 99170 | 69.62 | 2.93 | <0.001 | -0.14 | Negligible |
| Weight (lbs.) | 102677 | 165.43 | 23.42 | 3316 | 169.53 | 19.71 | 99361 | 165.29 | 23.52 | <0.001 | -0.18 | Negligible |
| BMI | 102428 | 23.97 | 2.9 | 3310 | 24.29 | 2.31 | 99118 | 23.96 | 2.92 | <0.001 | -0.11 | Negligible |
| 1.5-mile run (minutes:seconds) | 98599 | 13:14 | 5:34 | 3037 | 10:33 | 5:32 | 95562 | 13:20 | 5:32 | <0.001 | 0.5 | Moderate |
| Sit-ups | 100181 | 40.86 | 13.19 | 3276 | 50.65 | 16.44 | 96905 | 40.53 | 12.93 | <0.001 | -0.76 | Moderate |
| Push-ups | 100184 | 41.43 | 15.48 | 3275 | 53.49 | 18.28 | 96909 | 41.02 | 15.22 | <0.001 | -0.81 | Large |
| FY | Count Total | Percent Total | Count SW | Percent SW | Count Non-SW | Percent Non-SW | p-value | Effect Size | Magnitude |
|---|---|---|---|---|---|---|---|---|---|
| 2023 | 21520 | 20.9% | 702 | 21.1% | 20818 | 20.9% | |||
| 2022 | 17093 | 16.6% | 777 | 23.4% | 16316 | 16.4% | |||
| 2021 | 24415 | 23.7% | 793 | 23.9% | 23622 | 23.7% | <0.001 | 0.04 | Weak |
| 2020 | 14339 | 13.9% | 413 | 12.4% | 13926 | 14.0% | |||
| 2019 | 25728 | 25.0% | 638 | 19.2% | 25090 | 25.1% |
TABLE 2: Baseline anthropometric and fitness values by SW-status for males 17–30 years, during FY19-FY23
3.1 Anthropometric Differences
When it comes to raw physical build, Air Force Special Warfare (SW) candidates show some clear, though subtle, differences compared to their non-SW peers. According to the data, Special Warfare recruits were:
- Slightly taller (70.03 inches vs. 69.62 inches),
- Heavier (169.5 lbs vs. 165.3 lbs), and
- Carried a slightly higher BMI (24.3 vs. 24.0).
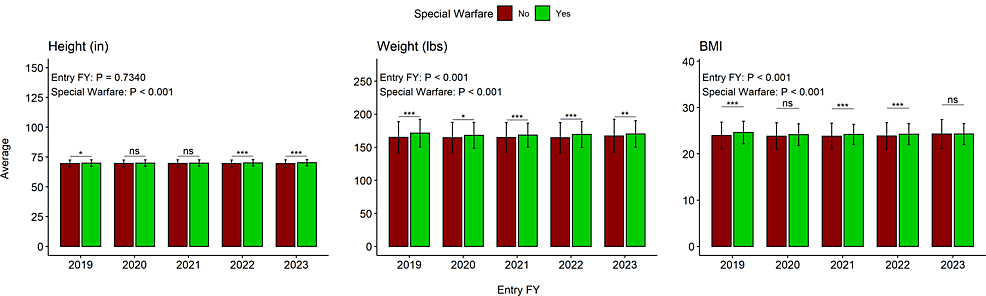
All these differences were statistically significant with p-values less than 0.001. However, from a practical standpoint, the effect sizes were negligible. This implies these metrics likely don’t hold much weight (pun intended) in predicting success on their own.
But there’s an interesting trend when we zoom out over the five fiscal years (FY19 to FY23). Here are a few notes:
- BMI and weight saw notable shifts year-over-year.
- FY23 recruits had significantly higher weights across the board compared to those from FY20 and FY21.
- SW candidates in FY19, FY21, and FY22 consistently carried slightly higher BMIs than their non-SW peers.
The statistical analysis also identified a significant interaction between BMI and fiscal year, indicating that the gap between SW and non-SW BMIs wasn’t static and changed slightly from year to year.
So, while the average SW candidate might not look dramatically different than a non-SW recruit at first glance, their physical profiles are just a bit more “built.” Think of it as a slight edge in body composition that, when paired with superior fitness (which we’ll cover next), becomes a key part of their selection profile.
3.2 Fitness Performance: Push-Ups, Sit-Ups, and 1.5-Mile Run
From the very start of Basic Military Training (BMT), Special Warfare (SW) candidates clearly outperform their peers in physical fitness assessments. On average, SW candidates clocked a 1.5-mile run time of 10:33, which is 2 minutes and 47 seconds faster than the 13:20 average of non-SW recruits. That difference is a major indicator of the aerobic capacity needed for the SW pipeline.
The difference was statistically significant across all years (p < 0.001), and the 2022–2023 period showed even better results than earlier years, especially among SW candidates.

The sit-up (MSU) performance showed similar results. Special Warfare recruits completed an average of 50.65 sit-ups, while non-SW recruits averaged 40.53 (a difference of ~10 reps). The SW cohort outperformed in nearly every fiscal year, with the only exception being 2021, where performance dipped slightly across the board. Again, this interaction between year and SW status was statistically significant (p < 0.001), reinforcing the consistency of this trend.
The most striking gap appeared in push-up (MPU) performance. SW recruits averaged 53.49 push-ups, compared to just 41.02 in the non-SW group. This difference had a large effect size, backed by p-values < 0.001 across the board.
Most importantly, SW candidates consistently maintained higher performance year over year, while non-SW candidates remained relatively flat. In short, before even stepping into specialized prep courses, SW candidates already demonstrate higher physical readiness, particularly in muscular endurance and cardiovascular performance.
4. Anomalies in Data
4.1 What Happened in 2021–2022?
The performance dip in 2021 and 2022 wasn’t just a blip. Across nearly every metric, both Special Warfare (SW) and non-SW candidates showed a decline in physical performance. 2021 was the only year when SW candidates didn’t outperform in muscular endurance, and 2022 saw slower run times across the board.
So, what happened? Well, we all know, unfortunately. While this study didn’t delve into qualitative factors, the authors pointed to a clear and likely cause: the impact of COVID-19 on physical activity and youth development.
School closures, reduced organized sports, social isolation, and a decline in physical education programs all contributed to a generation of recruits entering Basic Military Training (BMT) with lower baseline fitness levels. This wasn’t limited to the Air Force. Studies across military and athletic populations have shown reduced endurance, strength, and motivation post-pandemic, particularly among young adults from lower socioeconomic backgrounds.
The Air Force adjusted to the pandemic by introducing policies aimed at maintaining production numbers, even as average fitness levels declined. Recruits in 2021–2022 were still required to meet basic standards, but the broader context created a noticeable dip in readiness.
This matters. Because while performance numbers rebounded post-pandemic, the FY21–22 cohorts serve as a reminder: fitness is not just about effort. It’s also about environment, preparation, and long-term consistency. Avoid relying on BMT to “get in shape.” And above all, recognize that your training starts long before the pipeline.
4.2 Study Limitations
This study encountered several critical limitations that are worth highlighting. Chief among them was the sheer volume of missing data across both dependent and independent variables. Inconsistent recordkeeping made it difficult to run clean, side-by-side comparisons, especially since the gaps weren’t concentrated in one group or metric.
Different data points were missing for various individuals across different performance categories, which necessitated the exclusion of large groups of data. Since this was a post hoc analysis, the team didn’t have the luxury of returning to fill in the blanks or verify omissions, and there were no manual logs or annotations to clarify why certain records were incomplete. The result? A more limited dataset than ideal, despite the large sample size.
Additionally, while the 2021–2022 fitness drop-off has already been linked to COVID-19, it’s worth noting that the pandemic also disrupted data collection protocols themselves.
According to a 2021 report from the Human Performance Directorate at the 737th Training Support Squadron, Air Force BMT revised its fitness programs multiple times during COVID-19 due to distancing requirements and even shortened the overall training cycle by a full week.
5. How I Train My Students for SW Success
If you’re aiming for AFSPECWAR, you need to start showing up early. No, I don’t mean coming at 0500. The research makes it crystal clear: those who perform well weren’t counting on BMT to get in shape. They came in ready.
As a coach, I utilize real-world data, such as the findings from this study to reverse-engineer what works.
Feel free to apply for personalized 1-on-1 coaching.
Source: Mata J D, Patrick A L, Tchandja J N, et al. (June 28, 2024) Anthropomorphic and Physical Fitness Characteristics of United States Air Force Basic Military Training: Special Warfare Versus Nonspecial Warfare Recruits, Fiscal Year 2019-2023. Cureus 16(6): e63391. doi:10.7759/cureus.63391
